
Levirge DevOps · plugin
TP-Link Omada
Monitor a TP-Link Omada controller behind a firewall through the outbound devops-client: sites, devices, clients and alerts, with no inbound port.
Levirge DevOps is in private testing, with no public devops-client download yet.
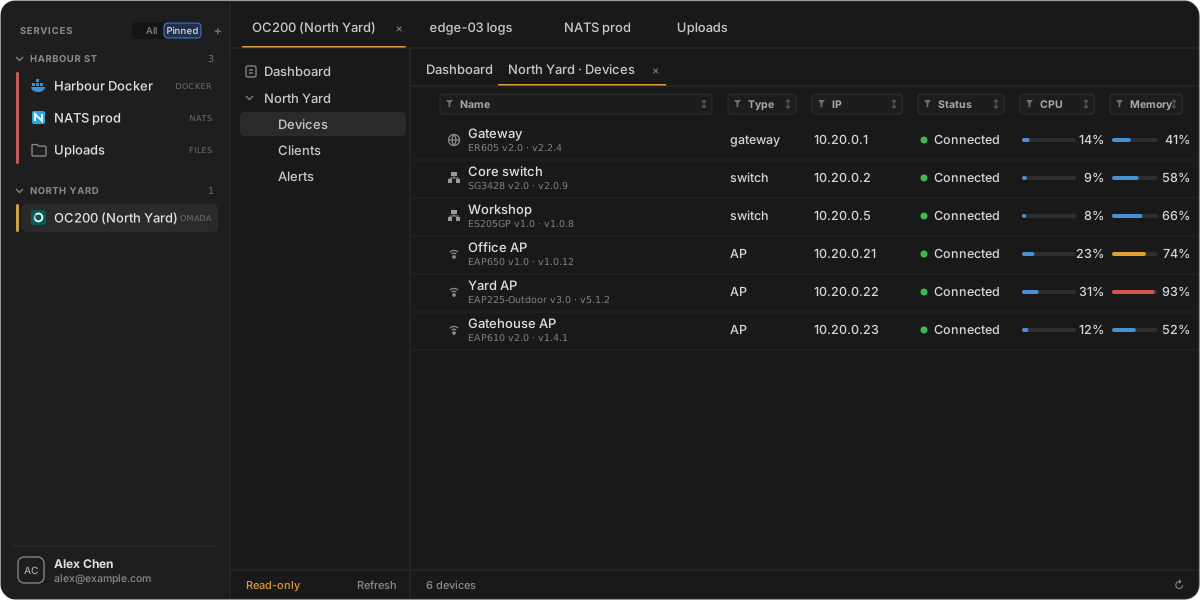
Illustrative mock-up with made-up data, not a screenshot.
Features
- A dashboard card per site: gateways, switches, access points and clients, as connected / total
- A site tree with Devices, Clients and Alerts, each opening in its own tab
- Devices table: type, name with model and firmware, IP, status, and CPU and memory bars that turn amber past 70% and red past 90%
- Device details: MAC, IP, firmware, uptime, uplink, last seen, and the clients connected to it
- Clients table: name, MAC, IP, the access point or switch it's on, network, signal, download and upload traffic, and state
- Alerts with level, module and message, over the last 24 hours, 7 days or 30 days
- A filter on every column; columns with few values offer a dropdown with counts
Capabilities
- Works with an Omada SDN controller, such as an OC200, that devops-client can reach on the local network.
- Connections are read-only by default.
- On a connection that isn't read-only, you can reboot a device and block or unblock a client. Each action asks for an authenticator code first.
- Every read and action is recorded in the audit log.
Limits
- The controller must be reachable from the machine running devops-client.