
Levirge DevOps · plugin
Host metrics
Watch CPU, memory, disks, network, GPUs and top processes on a machine behind a firewall through the outbound devops-client.
Levirge DevOps is in private testing, with no public devops-client download yet.
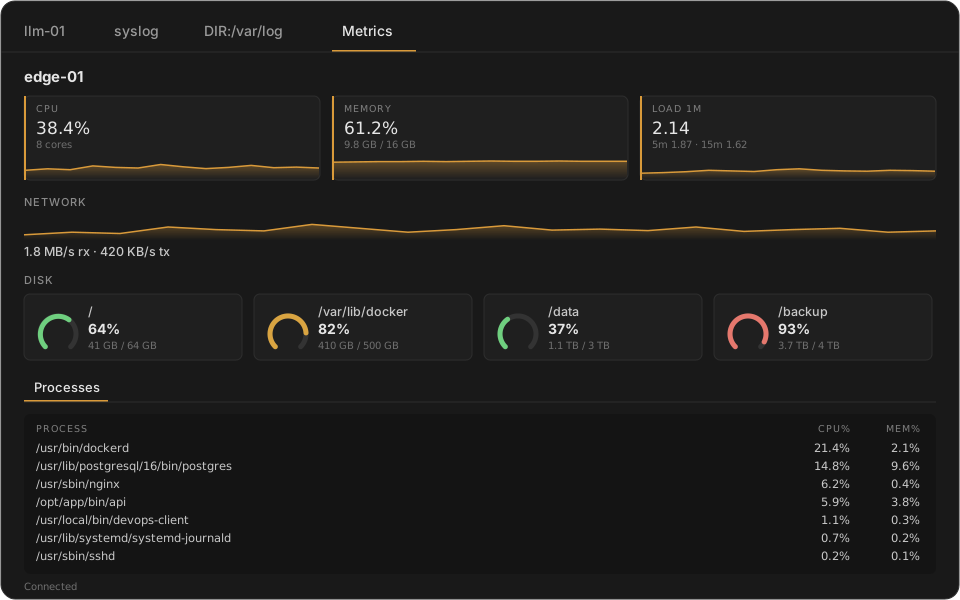
Illustrative mock-up with made-up data, not a screenshot.
Features
- CPU, memory and load average, each with a live chart
- Network receive and send rates
- Disk usage as colour-coded gauges: amber from 75%, red from 90%
- GPU utilization and memory, where the card reports them
- Top 10 processes by CPU, with memory share, loaded on demand
- A connecting, connected or "no recent data" status
Capabilities
- Disk gauges show real disks only. Memory filesystems, OS system volumes, simulator images and recovery partitions are left out.
- GPU metrics cover NVIDIA, AMD and Intel Arc cards: utilization, VRAM, temperature and power.
Limits
- Which GPU fields appear depends on the card and permissions. Integrated Intel graphics reports only its name, and some NVIDIA cards don't report power. Discrete AMD cards haven't been tested.
- "No recent data" shows after 30 seconds without a sample.
- Host IP addresses aren't reported yet.